How One District Is Answering the Underlying Questions About Screen Time With Learning Walk Data
Turn the screen-time debate into a conversation your district can use to build trust with your community.


The screen-time debate is at the intersection of two of the most important things you carry as a district leader: effectively preparing every student for their future and clearly communicating with families about the intentional decisions you are making to accomplish that goal. To make matters more complicated, you are being asked to lead during a rapid technological transformation, which is creating a significant amount of uncertainty about the future.
All of that makes it tempting to treat this as a technology problem to be contained: write more policy, define language and tools, and do more professional learning. But Erin Mote put it best in her closing remarks at a recent ERDI symposium: "innovation moves at the speed of trust." In the turmoil that is this debate, you have a hidden opportunity to build trust and accelerate the work of preparing your students.
The problem with high-level screen time stats
Your district can probably already produce some reporting on a student's screen time. A content filter or network monitoring tool will show when devices were active, which sites and apps students reached, and for how long. On the surface, that looks like all the data you need to address your community’s questions about screen time. But that data only lets you speak to how much screen time happened, not what students were actually doing.
Your community's deeper questions are about context and quality: the learning happening around the device, and whether students are creating and thinking with their digital tools or just passing time on them. A network report can't tell you whether a student was creating or consuming, or whether a screen was a shared class display or thirty individual devices. More importantly, it says nothing about what was happening off-screen.
A more effective approach
Details like whether a book was open on the desk, whether physical resources were in students' hands, and whether the lesson included conversation and group collaboration are critical to clearly communicating how your district is using technology to prepare students. And those are the parts of the conversation that actually build trust with your community.
What Mote and InnovateEDU hear from the field matches that gap. The message that resonates most isn't a rigid defense of all technology; it's acknowledging the stated concern and then showing intentional use that favors active learning over passive scrolling. The catch is that showing intentional use takes more evidence than just summary usage stats.
Without deeper evidence, you're left in the middle of the conversation with no way to prove your instructional intent has been implemented effectively. Which quickly becomes a barrier to building trust with your community when an anecdotal concern reaches a board member secondhand: a child's offhand "we're on Chromebooks all day in Miss Smith's class," a comment from another parent, or that book or article making the rounds.
That one anecdote can begin to dominate the conversation across an entire district. It is almost impossible to answer one anecdote with another anecdote or with general reassurance. The only reliable way to lead the conversation is with a clear, specific picture of what is actually happening in your classrooms.
That's why we want to highlight one of our partner districts. They set out to answer these deeper questions, build trust with their community, and lean into the screen-time conversation with a clear, evidence-backed story of purposeful technology use. They found what they needed in their classroom observation data, which they were already collecting and analyzing in Classroom Mosaic.
Partner District Highlight
A year of this district's classroom observation data surfaced conversation-defining trends. First, how rarely a Chromebook was used (22%) compared to printed materials (49%), which appeared more than twice as often, directly contradicting community assumptions. Second, how that Chromebook time went mostly to applying and extending their thinking, demonstrating elevated rigor and an intentional learning environment. And third, how device use rose sensibly with grade level, light in the early years, and climbing through middle school.
Background
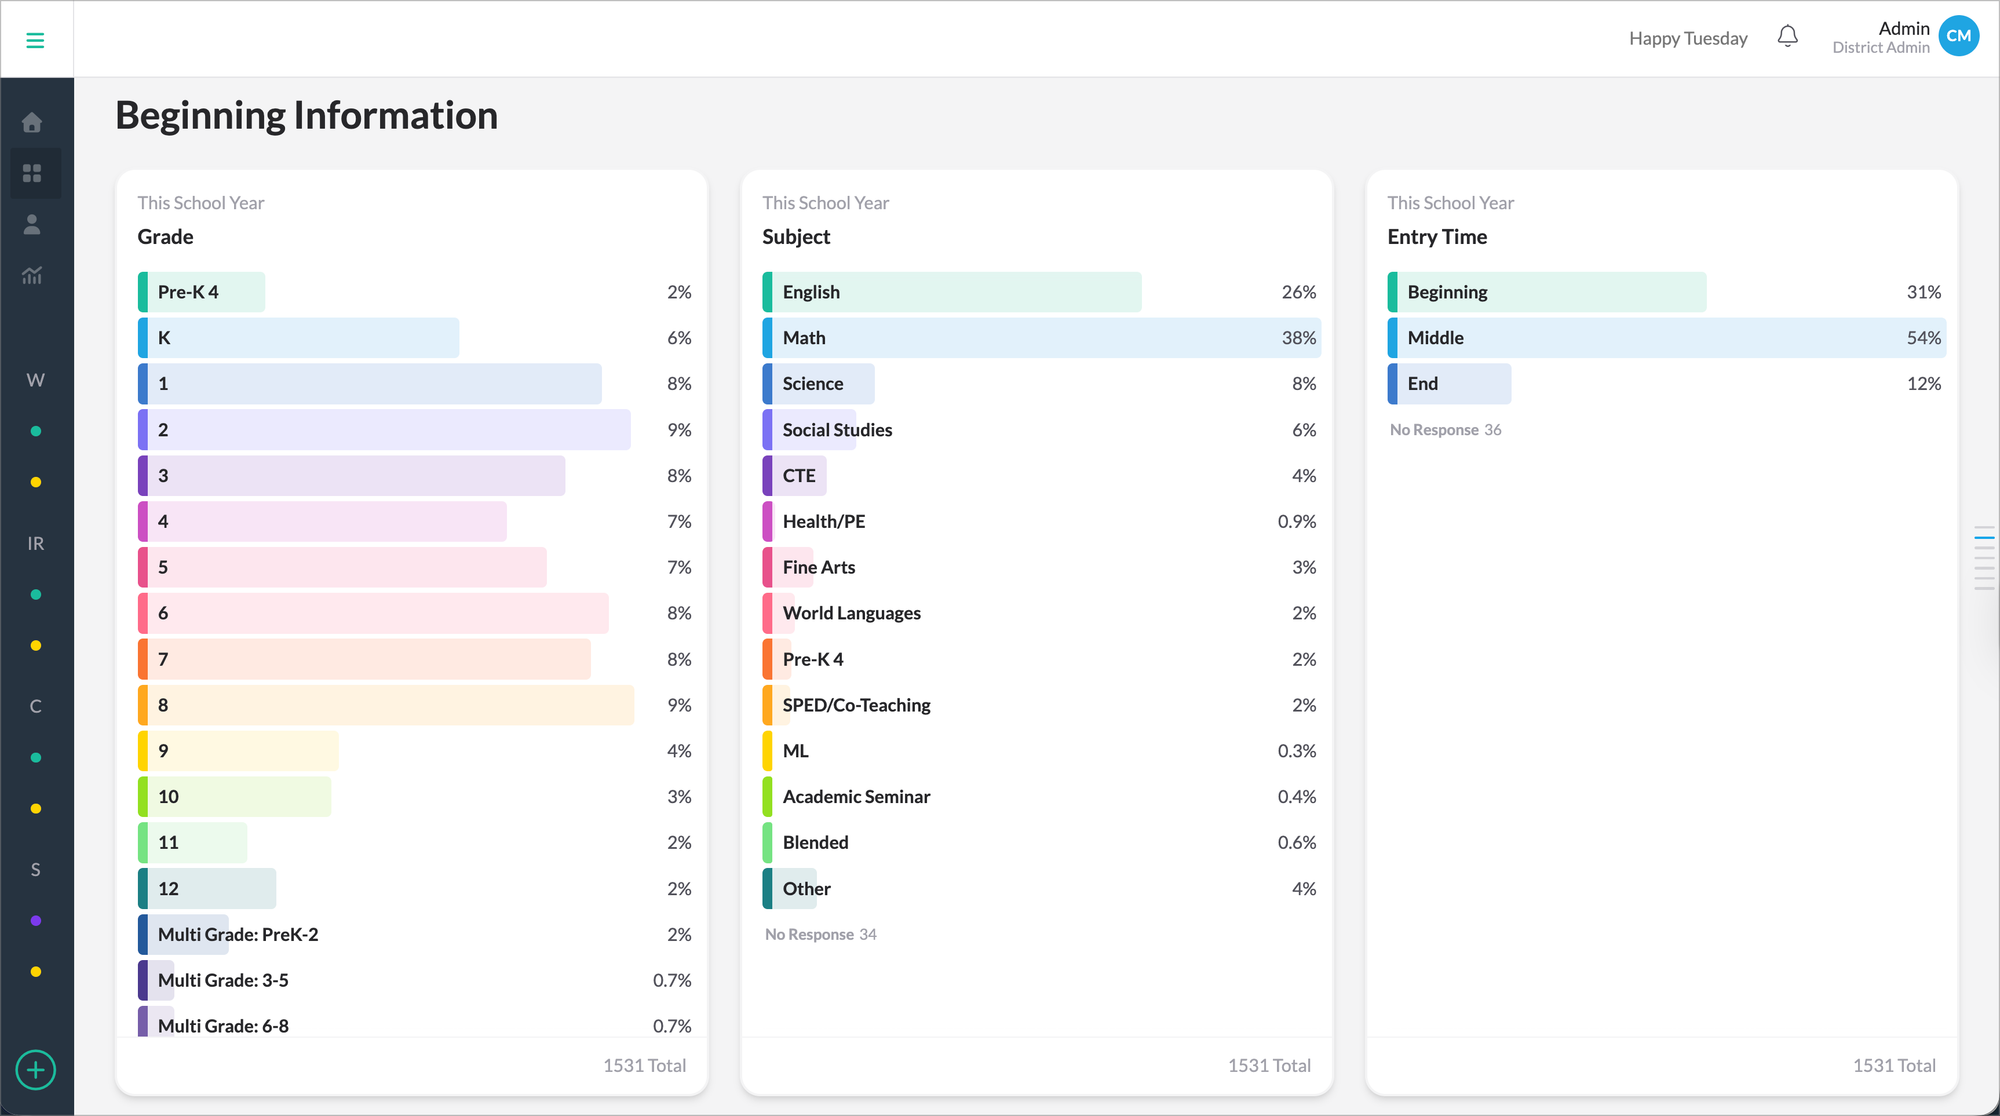
This district is located in the southeast, has about 15,000 students across roughly 25 buildings. The data was compiled from 1,531 learning walk observations during the 25-26 school year. District and building leaders captured data from all schools and all grade levels.
Each visit lasted about 10 minutes, and most took place in the core subject areas, with English and math classes accounting for 65% of the total. Observations were spread fairly evenly across the year, averaging about 170 a month. And the majority of observations captured data during the middle of the lesson, where you’d expect to see the primary instructional tools used.
Learning tools in use
As part of the observation form, observers are asked to capture all the learning tools in use. Observers can select multiple tools during a single observation, giving us a clear picture of broad trends across the district.
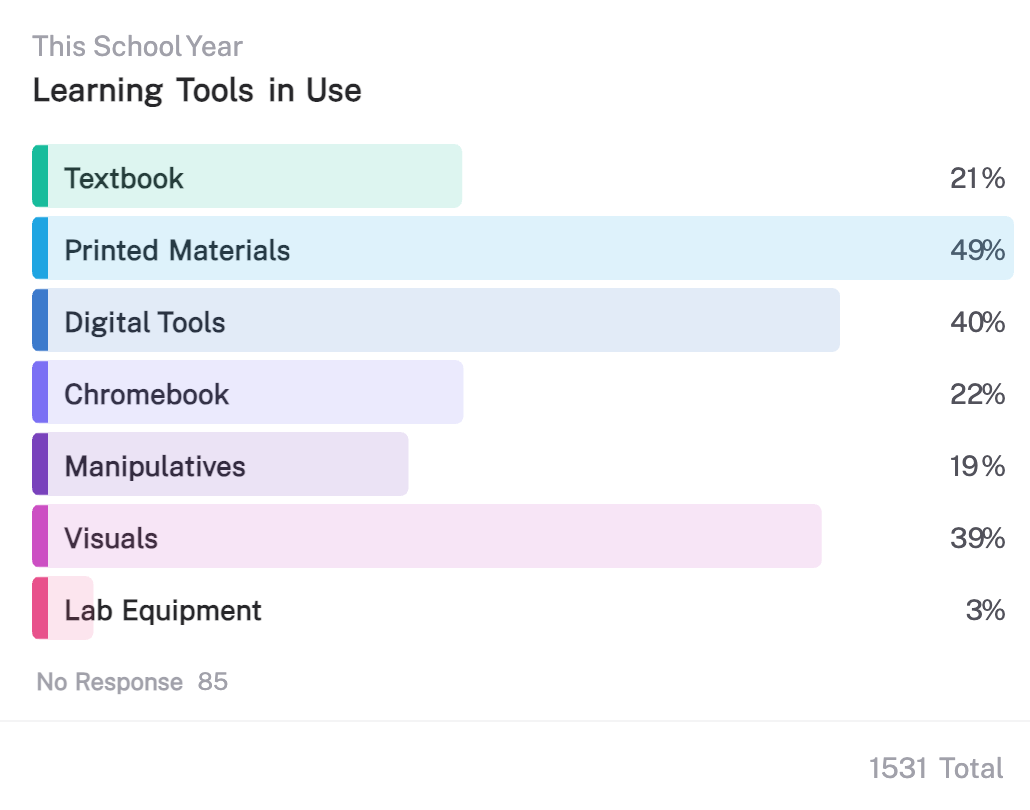
The most common tool in the district's classrooms was printed materials, recorded in 49% of observations. Chromebooks appeared in 22%, which means that in roughly four of every five visits across the year, no Chromebook was in use during the observation. Printed materials appeared more than twice as often as Chromebooks, with textbooks, manipulatives, and visuals each holding a steady place alongside them.
Chromebooks only appeared in 22% of observations
The gap between "digital tools" at 40% and "Chromebook" at 22% is due to the wide array of digital tools being used in a classroom. In reviewing photos of classrooms with digital tools, the most frequent digital tool is a projector for shared problem-solving, lesson instructions, or a display that the whole class is looking at together, rather than each student working on an individual device.
Digging deeper, when Chromebooks were in use, printed materials were also used 49% of the time. In reviewing the associated comments, there was a wide range of additional materials used, spanning from fraction tiles, whiteboards, and handouts.
This summary data alone tells a clear story of intentional technology use and provides meaningful context around how often technology is used. In addition, this district can distinguish between technology being present in a room and every child being on a screen. Those are two situations that are often treated as one and are very important to disaggregate and differentiate in conversations with your community.
Intentional Chromebook usage across grades
Filtering to the 330 observations when Chromebooks were being used, we begin to see a much richer picture of intentional technology use across the district.
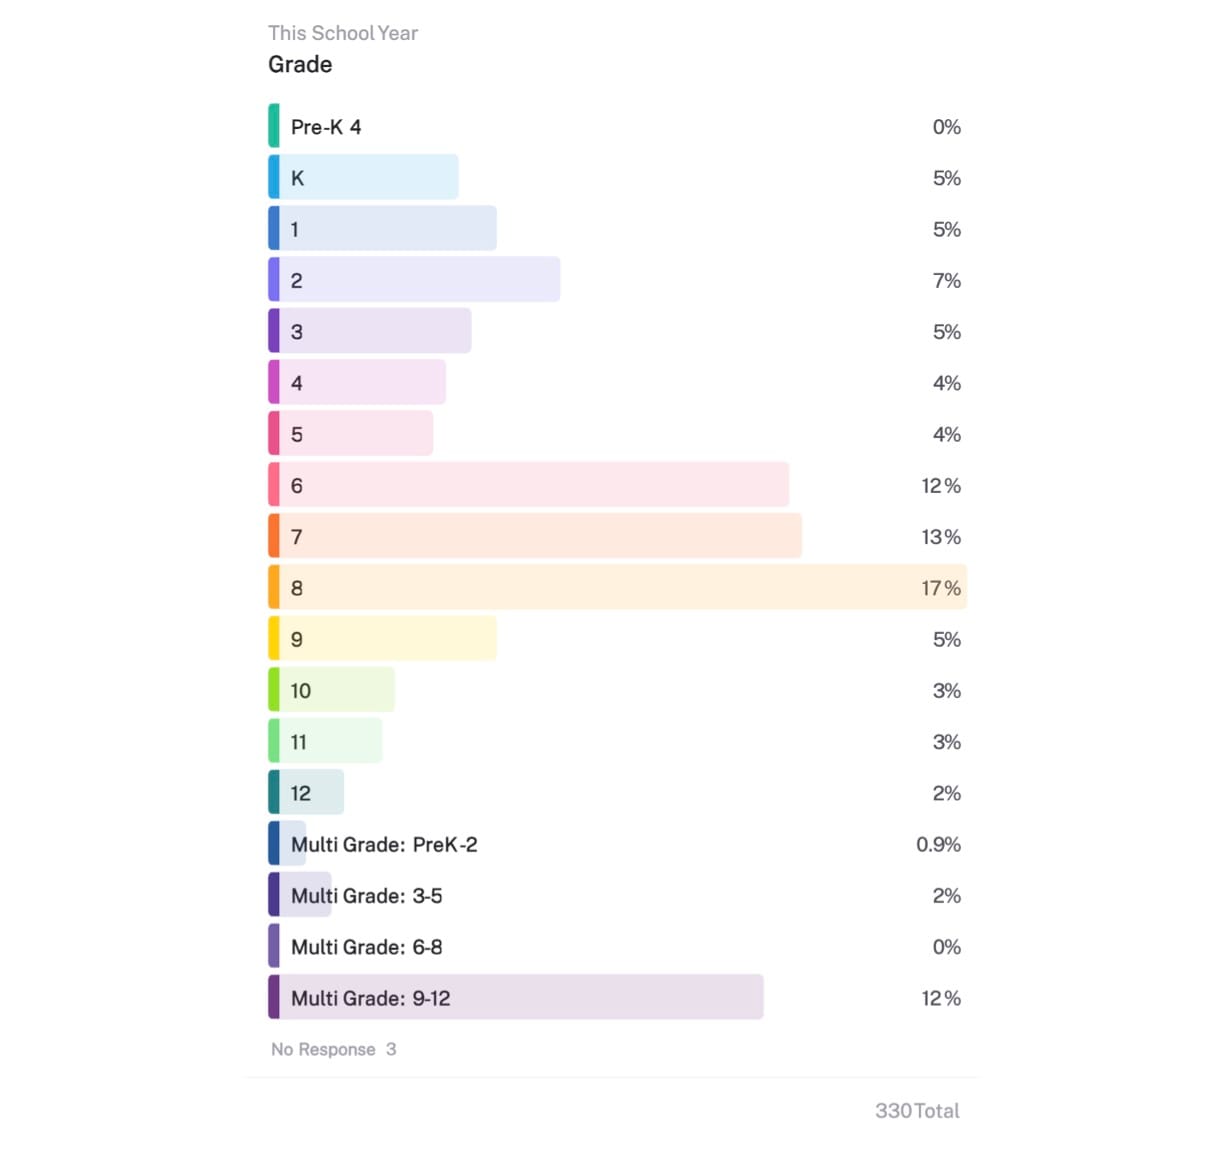
When Chromebooks were used, they were not evenly distributed across grade levels. It concentrated in the middle and higher grades, while individual elementary grades ranged from 4% to 7%.
This pattern shows how teachers throughout the district change their instructional approach and tools as students grow, with less device time in the years focused on early reading and hands-on work, and more as the work shifts toward research, drafting, and analysis.
The evidence that this intentional approach is showing up in classrooms throughout the year gives this district the ability to ground the conversation in InnovateEDU’s recommended approach, acknowledging the concern and then demonstrating intentional use.
Higher orders of rigor during Chromebook usage
The walkthrough form also recorded the cognitive demand of students’ tasks, scored by Depth of Knowledge. DOK is rated on a scale of one to four, and measures rigor by capturing how far students must go beyond the lesson's surface skills. Here's the summary of cognitive demand during Chromebook usage across the 330 observations:
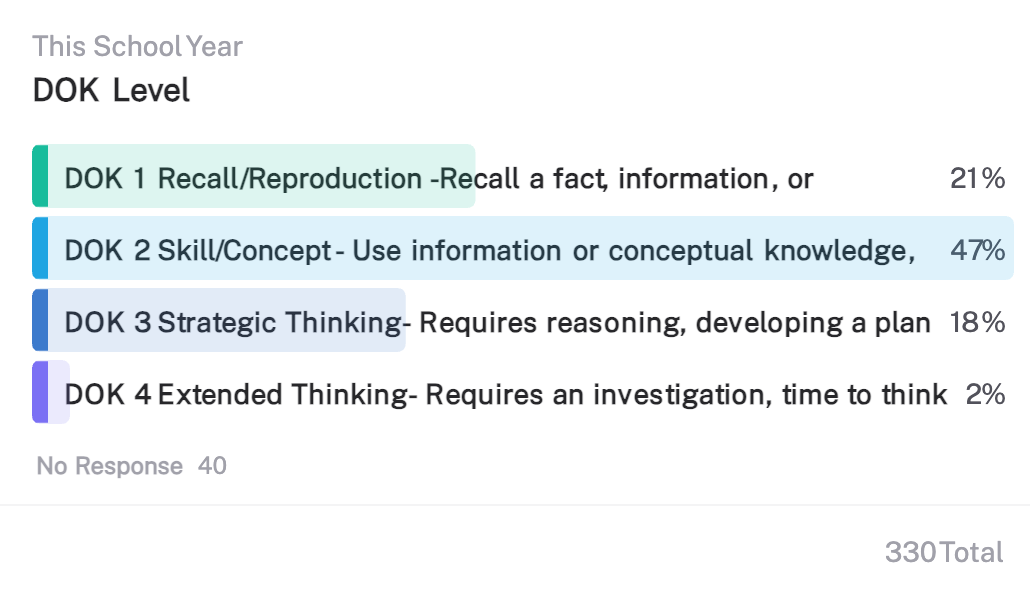
When students were on Chromebooks, only 21% of the work was DOK 1, where students were doing recall or reproduction. Nearly half, 47%, was DOK 2, applying skills and concepts, and another 20% reached DOK 3 or 4, strategic and extended thinking.
Taken together, about two-thirds of recorded Chromebook use involved students applying or extending their thinking rather than simply retrieving facts. This is the concrete answer to the question hiding underneath most screen-time concerns: not how often students are on a device, but what they are doing while they're there.
Time spent mostly at DOK 2 and above is the opposite of passive scrolling. It represents students using technology to apply skills, reason, and build something.
So when a parent or board member asks what all that Chromebook time actually amounts to, you can answer with evidence: for the most part, active thinking, not passive consumption.
Broader trends hold true across every grade level
The grade-by-grade breakdown shows the same trends in finer detail, allowing the district to speak in detail to community comments or questions across the district.
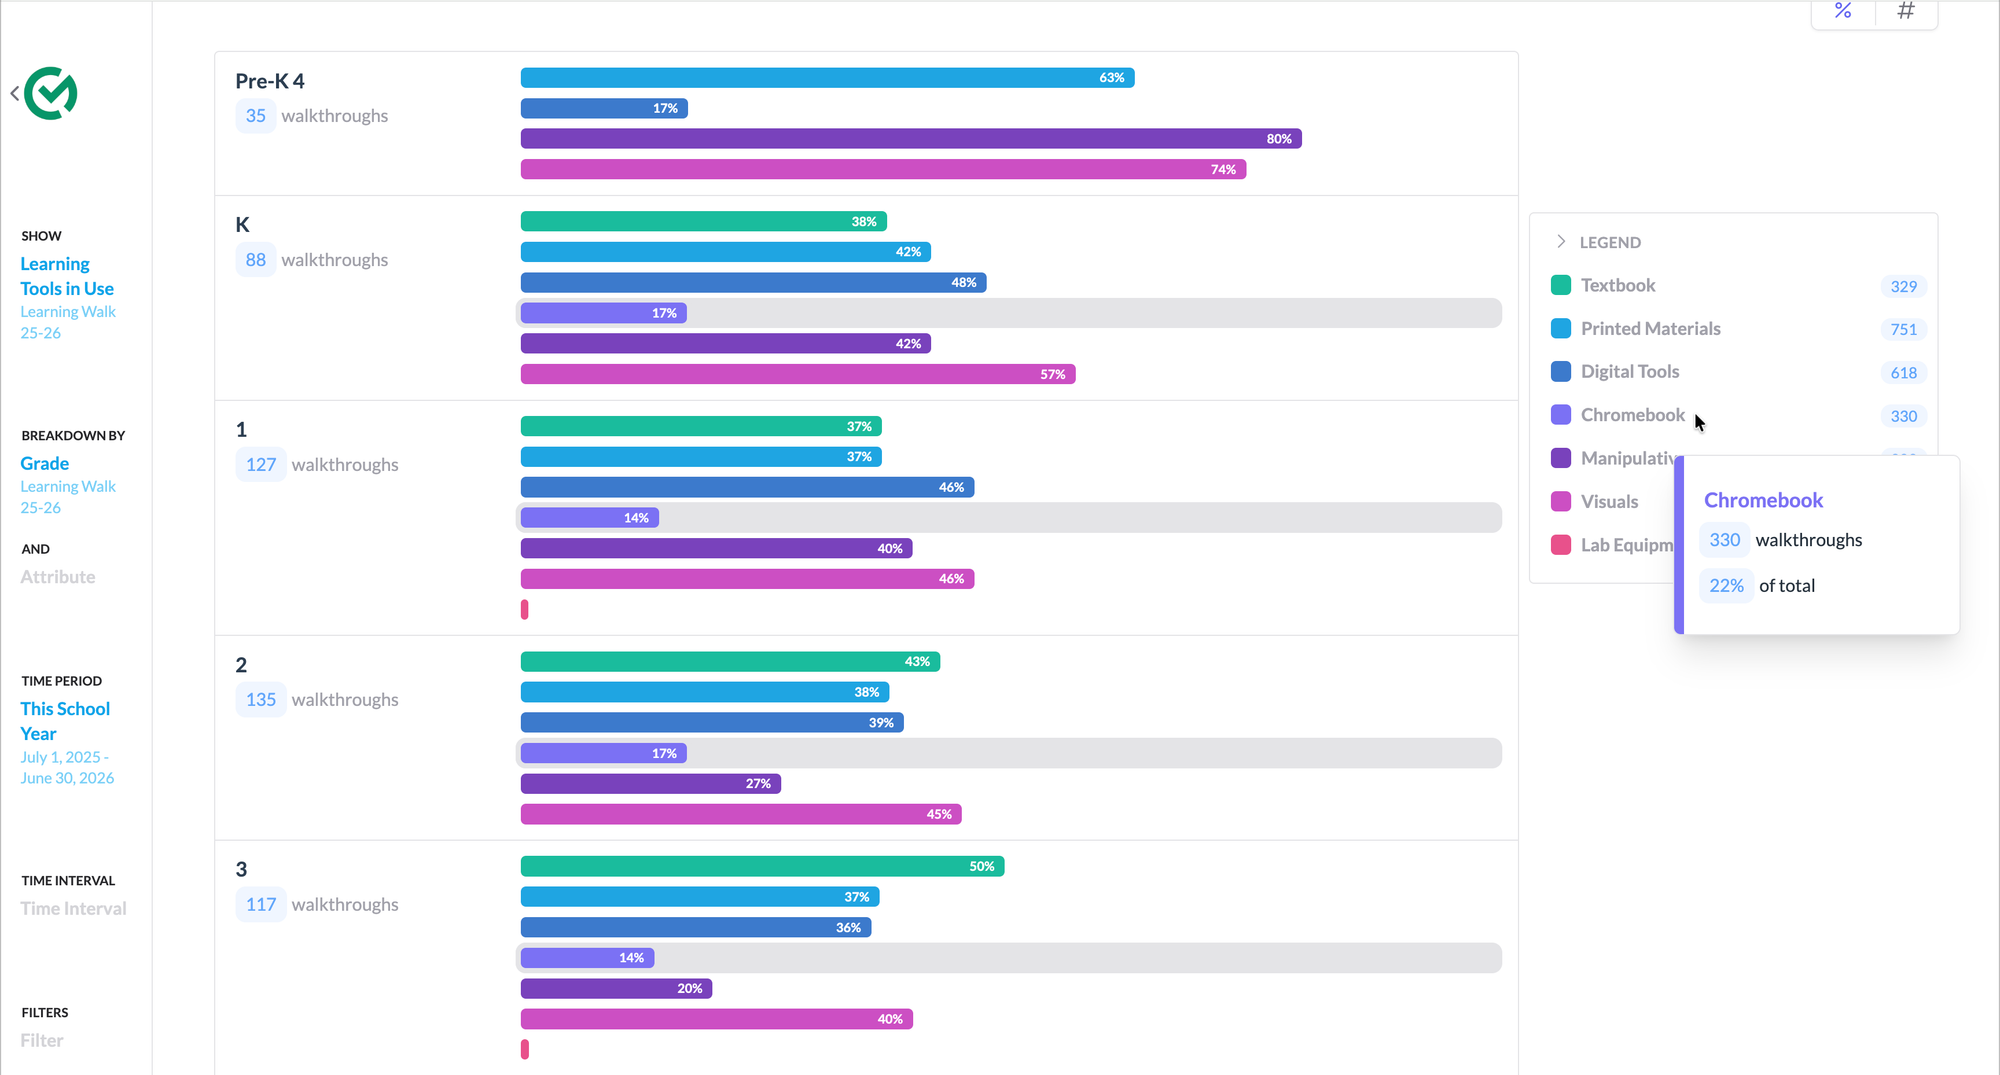
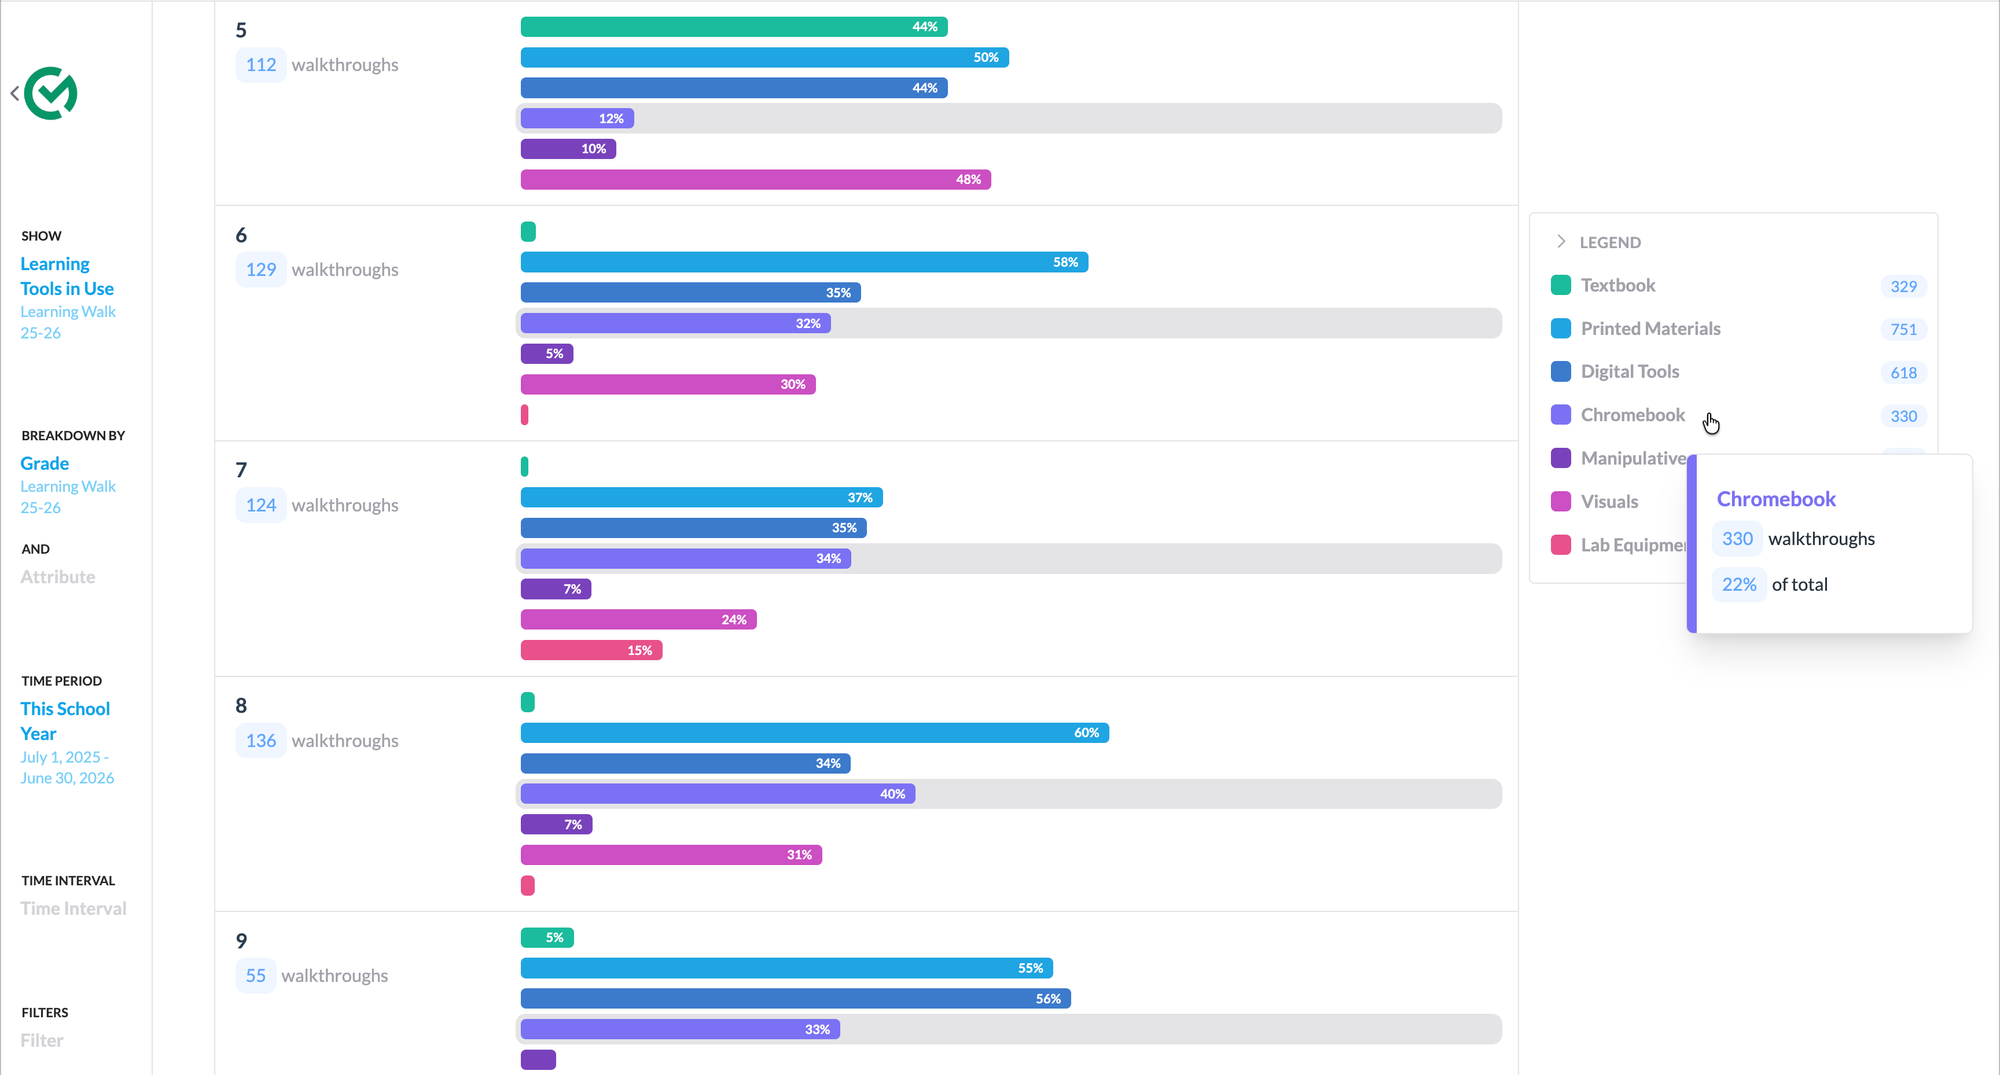
Following Chromebook use up through the grades, it begins near zero in Pre-K, holds between 14% and 17% through the early elementary years, and rises to 32%, 34%, and 40% in grades 6, 7, and 8.
The youngest classrooms, meanwhile, are built around manipulatives and visuals. In Pre-K, manipulatives appeared in eight of every ten visits. The technology enters gradually, as the nature of the learning changes. And even in 8th grade, where Chromebook use is at its highest at 40% of observations, printed materials remain the most common tool, present in 60% of observations.
Most importantly, printed materials led Chromebooks across all grade levels. The gap was widest with the youngest students in 5th grade, 50% vs 12%, more than four to one and narrowed as Chromebook use climbed, nearly even in 7th grade (37% vs 34%) before print pulled back ahead in 8th (60% vs 40%)."
The data reveals an intentional approach
Learning tools trends across the district reflect the district's intentional approach to technology use. The district explicitly trains and coaches teachers to intentionally use digital and physical materials in their lessons together. We see evidence of that approach in the data: Chromebooks, text, manipulatives, and visuals, working with the devices rather than being replaced by it.
That's what turns a set of charts into the deeper story your community is actually asking about. The data describe the practice, and the practice reflects a clear intention and execution of purposeful technology use throughout the classroom.
Evidence considerations
The most powerful evidence you can bring to this conversation is direct evidence from your classrooms, as what is happening in your classroom is at the core of the debate. Observations provide the perfect opportunity for an observer to gather first-hand evidence consistently throughout the year.
By contrast, a teacher survey captures a single moment in time and relies on self-reporting, which can provide helpful context, but a weaker basis for claims about what is really happening in classrooms. In addition, observation data is more objective, which makes it more credible and lets your community take the picture you're showing them at face value.
An important part of this example is the sample size the district had to draw from. 1,531 observations from across the year are a sufficiently large set for a district of this size. If you are planning to take this on, you need to consider how many classrooms you have and backwards map to the target number of observations. In addition, you would ideally include several types of observations from every classroom throughout the year.
This set came from learning walks, which intentionally visit many classrooms throughout a school all on the same day to capture instructional trends. Capturing this same data during walkthroughs and formal observations would help provide a broader picture without adding something else to the plate of instructional leaders.
Part of the reason you need a large sample size overall is so that the deeper analysis will have enough data for you to actually see trends. In this example, the analysis sections limited to 330 observations in which a Chromebook was in is on the smaller side, but still large enough to reveal some trends.
To make statistically validated and reliable claims, you’d need more data and a more regimented approach. However, that isn’t necessary here. You're not publishing a study; you're showing your community, with real evidence, what is actually happening in your classrooms. In addition, what matters most for reliability isn't sheer volume; it's that observations are spread representatively across classrooms, subjects, and the year, which is exactly what a regular learning-walk routine provides.
Using your data to build community trust
Showing evidence collected directly from your classrooms in a board meeting, a parent forum, or a community update speaks volumes about your approach. Rather than describing technology use in general terms, your district shows what is actually happening in classrooms.
For this district, that record reframed the whole conversation: in four of five classroom visits, no Chromebook was in use; when one was, students were applying or extending their thinking about two-thirds of the time; and the youngest learners spent their days largely with hands-on materials, by design.
A presentation like that does not aim to talk anyone out of a concern; it meets them where they are. It offers a fuller and clearer picture than the one most people arrive with, all grounded in evidence from your own classrooms. Having the data and being able to articulate it well is itself a demonstration that you have been paying close attention to the needs of your students and educators.
Planning for next year
The screen-time conversation is arriving in your district, if it isn’t already there. You can build the same picture from the observations your leaders are already conducting. The difference lies in what data you capture and the tools you have to understand it. To produce an analysis like the one above, consider adding a few questions to your walkthrough or learning walk form and using Classroom Mosaic to capture and analyze your data.
Questions
- Grade level and subject, gives additional context to the rest of the data collected and allows system level trends to be discovered.
- Learning tools in use, as a multi-select (textbook, printed materials, digital tools, Chromebook or device, manipulatives, visuals, lab equipment), which helps identify which tools are being used and separate specific technology (Chromebook) vs overall use.
- Grouping — whole class, small group, individual, which would help understand learning tool is being used.
- A rigor measurement like Depth of Knowledge of the task, DOK 1 through 4, which captures the cognitive demand of device time rather than only its presence and gives context to how the learning tool is being used.
Analysis
Every chart was generated directly from the district's walkthrough reporting in Classroom Mosaic. Producing these insights and breakdowns required no extra data collection, manipulation, spreadsheets, or cleanup.
Users can quickly surface this level of insight for all problems they tackle, including planning and monitoring the impact of professional learning, coaching teachers and leaders towards district goals, and celebrating the progress they have made.
If you’d like help preparing for next year or making your walkthroughs and learning walks as efficient and effective as possible, book a time with one of our experts.
Creating system wide coherence
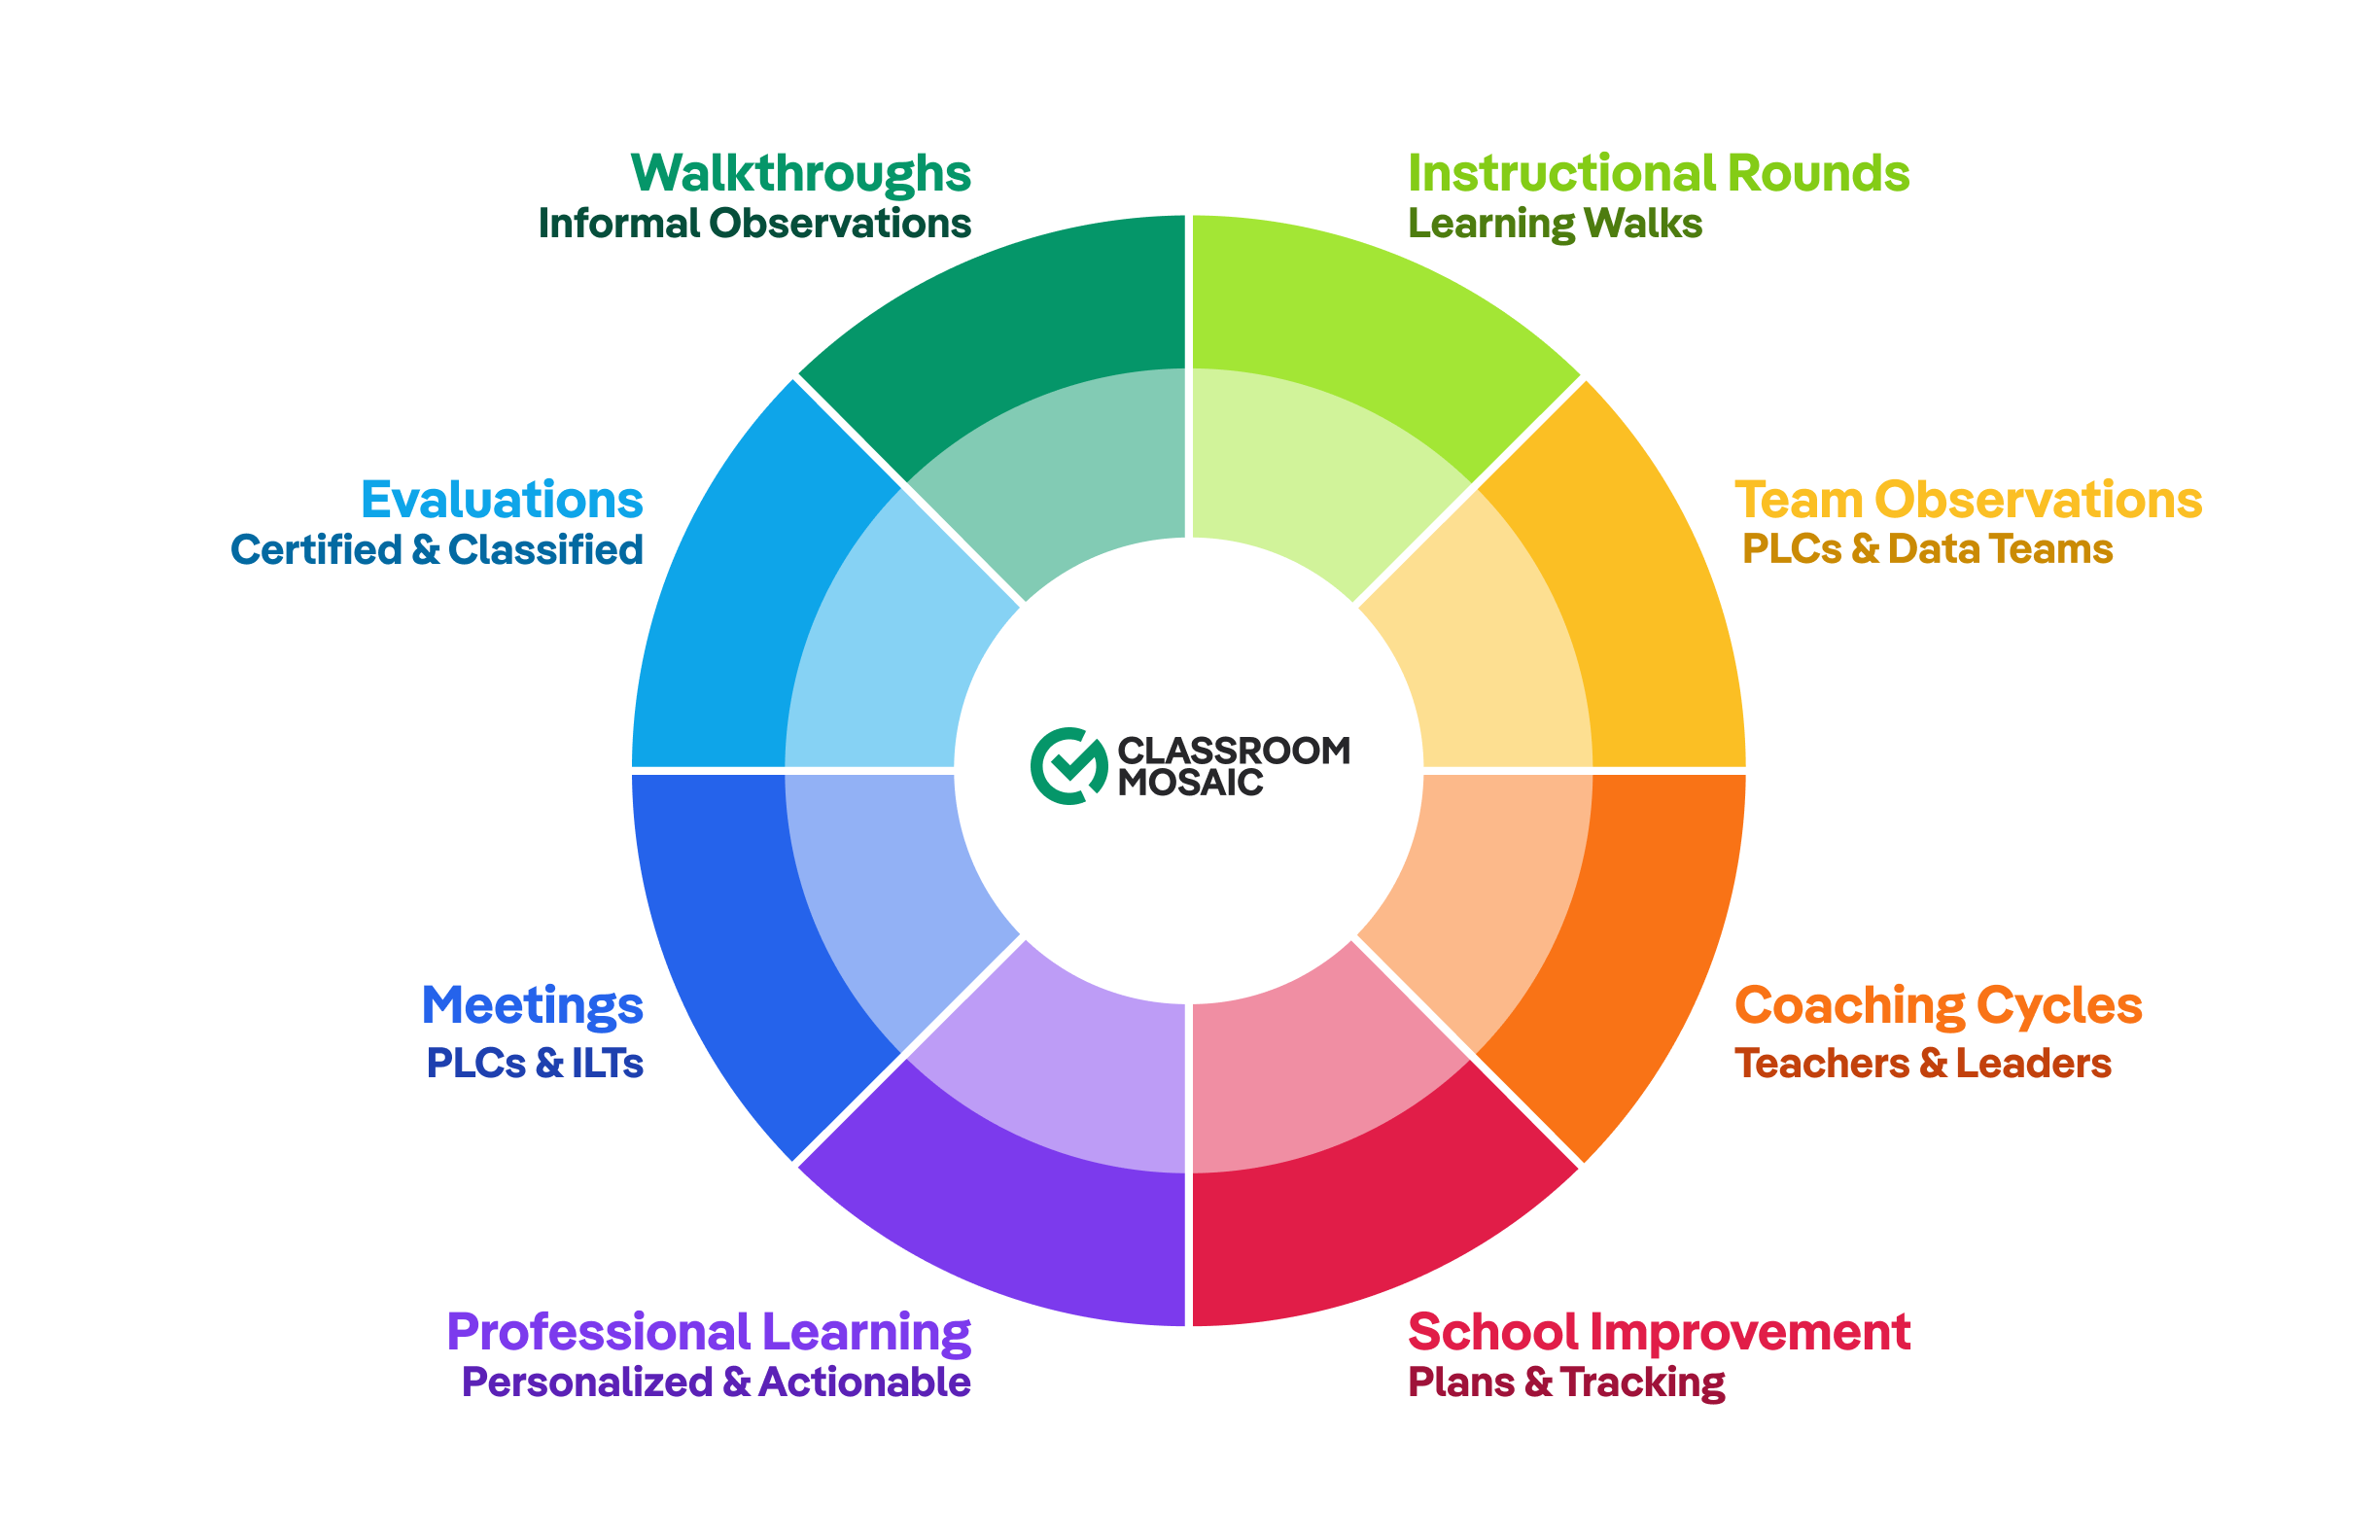
The observation analysis above is one piece of a bigger picture. Classroom Mosaic connects every instructional lever into one platform built for consistency, accountability, and cohesion. It helps create a single, coherent through line across all of your instructional work and helps make every adult as effective as possible.
Let's talk about how to bring that kind of coherence to your district, wherever you want to start. Get started →